The program is called 3D Grapher. After downloading it, install it - and you can start creating.
Note from 2023: This article was published on 3DJournal 20 years ago and is no longer current. We leave it here as a reminder of those days.
Before we go any further, we apologize to everyone who is friends with math. In the next explanation we will simplify a lot and explain things that they have known for a long time.
A light introduction to 3D charts
When we want to draw graphs in three dimensions - i.e. 3D - we will need 3 axes - a horizontal X, a vertical Y and a horizontal Z axis pointing away from us into the distance (into the depth of the monitor). However, the truth is that in Grapher you can rotate the axes in different ways, so the Y axis may end up being horizontal.
If we think of a chart as a bunch of little dots in space, then the mathematical notation of the chart tells us how the x, y, and z coordinates of each point are related. So, for example, if x = y = z, then the chart is the area in space that is formed by, for example, the points 1,1,1 or 2,2,2 or 6,6,6. When we want the chart to not look like a flat surface, we need to use a slightly more complicated formula - some non-linear function, such as x^2 or sin x.
Let's go draw
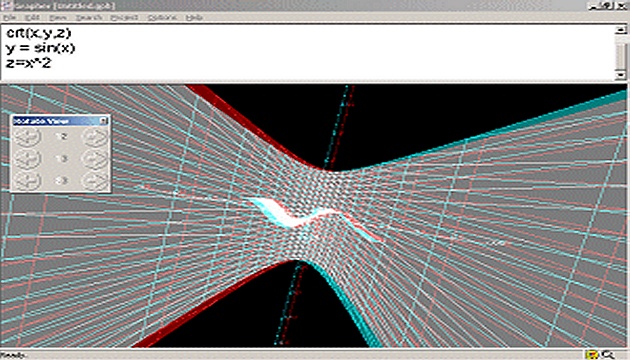
Now let's create the first chart. Type the following 3 lines in the top window of the Grapher:
rgb(1,1,0)
crt(x,y,z)
y = z = x
The first line determines the color of the graph (but the 3D image will end up being black and white anyway), in this case you mix r + g (red = red, green = green) to get yellow. The values of the trio of primary colours can vary between 0 and 1.
The second line says that we are going to draw a graph for the triplet of x, y and z axes and also sets the standard range of the graph - from - 5 to 5 (for values in this range, the individual points of the graph will be calculated). Finally, the third line is the equation of the graph itself - the flat surface already mentioned above.
Now just press F5 (or choose Project/Graph from the menu) and the chart will be plotted. To see the graph in 3D, choose View/Eyes/Anaglyph. However, before doing so, it is recommended to change the color for the left eye to red and for the right eye to green-blue in the Options/Graphing/Anaglyph menu (it has a green and blue component with a value of 255, red 0). And in the Options/Graphing/Eyes menu, set the Depth Perception for Anaglyph to the first comma from the left.
After rendering, you can use the arrows in the Rotate View window to rotate the image around any axis. If you double-click on an arrow, the graph will rotate itself in space. With 3D glasses, this is actually a very nice view for some charts.
Better 3D images
Now let's get to the more complex charts. If you add another line to the code for our first graph, for example z = 5, you will add another area (its z coordinates will be 5, the others will vary from -5 to 5). You can also add more lines like this - for example, z = 2, z = -2, x = 5 - and the surfaces will multiply further.
If you're tired of equal areas, try the equation y = sin(x). An undulating surface will appear. If you add the line z = cos(x), you will have another undulating surface perpendicular to it. If you write z = x ^ 2 instead of the second line, the z coordinate will become unbalanced - it will grow (and fall) much faster than x, so the resulting graph will also be quite different from its predecessors - and the 3D effect very pronounced.
And now it's time for your experiments. If you can't think of anything, try equations like z=x*sin(x)^2, z=x^3*sin(x)^2 or z=x^3*sin(x)^3. The automatic coordinate range from -5 to 5 can be set not only by the expression crt(x,y,z), but also by this: var x = -5 to 5 step 20 (the last value indicates how many steps it takes to get from -5 to 5). If you want to set a different range, you of course have the option.
The program includes a fairly extensive help. It is in English and quite understandable.
3DJournal, August 2003